简介
Maplibre-gl是一个开源的js库,用于在网页中创建高性能、交互式的地图应用。Maplibre-gl是Mapbox GL JS的免费替代品,提供与 Mapbox GL JS 类似的功能,同时坚持完全开源。
使用场景:
- GIS 系统:构建地理信息分析工具。
- 数据可视化:在地图上叠加热力图、轨迹、点云等数据。
- 室内地图:支持自定义楼层平面图和导航。
- 移动应用:通过 React Native 集成到跨平台应用中。
核心特性:
矢量切片(Vector Tiles)支持
使用矢量地图数据(而非传统栅格图块),允许动态样式调整和高分辨率渲染。
支持 .pbf 格式的矢量切片,兼容多种数据源(如 OpenStreetMap、自定义数据)。
WebGL 加速渲染
基于 WebGL 技术,实现高性能的地图渲染,适合处理复杂地图样式和大规模数据。
动态样式与交互
通过 JSON 格式定义地图样式(如颜色、图标、文字等),支持实时更新。
支持鼠标/触摸交互(缩放、拖拽、旋转、倾斜等)。
跨平台兼容
可在浏览器和移动端(通过 React Native 等框架)使用。
插件生态
兼容 Mapbox GL JS 的插件(如地图控件、标记点、动画效果等)。
提供额外功能扩展,例如地理编码、3D 地形等。
使用
第一步,npm安装:
1
2
| npm install maplibre-gl
npm install @types/maplibre-gl --save-dev
|
第二步,创建地图容器,必须明确指定宽高
1
| <div ref="mapContainerRef" style="width: 100%; height: 100vh;"></div>
|
第三步,渲染地图
1
2
3
4
5
6
7
8
9
10
11
12
13
14
15
16
17
18
19
20
21
22
23
24
| import { ref, onMounted, onUnmounted } from 'vue';
import maplibregl from 'maplibre-gl';
import 'maplibre-gl/dist/maplibre-gl.css';
const mapContainer = ref(null);
let map = ref(null);
onMounted(() => {
if (!mapContainer.value) return;
map.value = new maplibregl.Map({
container: mapContainer.value,
style: 'https://demotiles.maplibre.org/style.json',
center: [116.4, 39.9],
zoom: 10
});
});
onUnmounted(() => {
map.value && map.value.remove();
});
|
自定义地图
瓦片图Tile Map
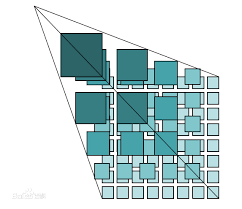
第一步,将一张大图切分位瓦片图。
地图通常都非常大,所以需要按照详细程度切分成不同等级的图片,根据缩放情况显示不同等级的图片,切分出来的一张张小图就是瓦片图。
瓦片图整体呈现出金字塔形式。
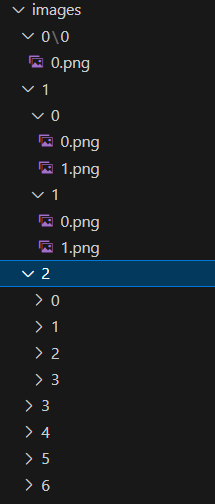
瓦片命名通常遵循 {z}/{x}/{y}.png 格式,其中z表示缩放级别,x和y表示瓦片坐标。切出来的瓦片图也以z/x/y的层级存放。
如何把不同编号的瓦片图放到对应位置,不同标准有不同规则。
谷歌XYZ:z表示缩放层级,x从左往右,y从上往下;
TMS:z表示缩放层级,x从左往右,y从下往上;
瓦片图的主要特点:
分块加载:地图被切分成小块(通常是256×256像素),按需加载可视区域内的瓦片。
多级缩放:每个缩放级别({z})都有一套完整的瓦片,缩放级别越高,瓦片数量越多,细节越丰富。
坐标定位:每个瓦片通过坐标({x},{y})和缩放级别({z})唯一标识。
按需请求:只加载视口内可见的瓦片,节省带宽和提高性能。
切分
切分有多种方式,比如图形界面MapTiler、gdal2tiles.py命令行工具、python库等。
如果只是一张普通的图片,推荐gdal2tiles.py。
第一步,安装GDAL。
1
2
3
4
5
6
7
8
9
|
conda install -c conda-forge gdal
pip install gdal
sudo apt-get install gdal-bin python3-gdal
|
验证是否安装成功:
如果提示:The program ‘gdal2tiles.py’ is currently not installed. You can install it by typing: apt install python-gdal,则执行以下命令
1
| sudo apt-get install python-gdal
|
第二步,生成tif文件
1
2
3
4
5
|
gdal_translate -of GTiff -a_ullr 0 [img width] [img height] 0 -a_srs EPSG:4326 input.png output.tif
gdal_translate -a_ullr -20037508.34 20037508.34 20037508.34 -20037508.34 -a_srs EPSG:3857 input.png output.tif
|
EPSG坐标参考系统
EPSG:4326 - WGS84经纬度
全球定位系统(GPS)使用的坐标系
坐标表示为经度/纬度度数
适用于全球范围的数据
非投影坐标系,不适合直接测量距离或面积
坐标范围:经度[-180, 180],纬度[-90, 90]
坐标单位:度
EPSG:3857 - Web墨卡托投影
Google Maps、OpenStreetMap等网络地图使用
坐标以米为单位表示
适合网页显示但在极地区域有严重变形
坐标范围:x轴[-20037508.34, 20037508.34],y轴[-20037508.34, 20037508.34]
对应坐标:经度[-180, 180],纬度[-85.0511, 85.0511]
坐标单位:米
第三步,生成瓦片图
1
| gdal2tiles.py -p raster -z 0-6 output.tif outputDir
|
-p 指定坐标系统
raster:简单像素坐标,适合游戏系统;
mercator:默认,适合网页地图;
geodetic:WGS84
-z 指定缩放层级范围
也可以只设置为一个数字,表示生成该层级图片。
部署地图服务
以node为例。
目录结构:
1
2
3
4
5
6
7
8
9
10
11
12
13
14
15
16
|
import express from 'express';
import path from 'path';
import { fileURLToPath } from 'url';
const app = express();
const port = 3000;
const __filename = fileURLToPath(import.meta.url);
const __dirname = path.dirname(__filename);
app.use('/images', express.static(path.join(__dirname, 'images')));
app.listen(port, () => {
console.log(`服务已启动:http://localhost:${port}`);
});
|
maplibregl.Map()的配置项
1
2
3
4
5
6
7
8
9
10
11
12
13
14
15
16
17
18
19
20
21
22
23
24
25
26
27
28
29
30
31
32
33
34
35
36
37
38
39
40
41
42
43
44
45
46
47
| map.value = new maplibregl.Map({
container: mapContainerRef.value,
style: {
version: 8,
name: 'Simple Style',
sources: {
background: {
type: 'raster',
tiles: ['/api/{z}/{x}/{y}.png'],
tileSize: 256,
minzoom: 0,
maxzoom: 6,
scheme: 'tms'
},
points: {
type: 'geojson',
data: {
type: 'FeatureCollection',
features: [
{
type: 'Feature',
properties: {title: '这是一个数据点'},
geometry: {
type: 'Point',
coordinates: [0, 0]
}
}
]
}
}
},
layers: [
{
id: 'background-layer',
type: 'raster',
source: 'background',
paint: {
'raster-opacity': 1
}
},
],
glyphs: 'https://demotiles.maplibre.org/font/{fontstack}/{range}.pbf',
},
zoom: 2,
renderWorldCopies: false,
attributionControl: false,
})
|
container的参数可以是DOM元素,或者元素的id。该元素不能有子元素。
zoom表示初始缩放级别,默认为0。
renderWorldCopies表示在左右方向是否重复渲染地图,默认为true。
attributionControl表示是否在页面上显示库信息,默认为true。
style.sources定义资源,包含底图和数据源,也可以通过addSource方法添加。
1
| type: 'raster' | 'vector' | 'geojson' | 'image' | 'video' | 'raster-dem'
|
raster 瓦片地图
vector 矢量地图
geojson 数据点列表
image 单一图片
video 视频
raster-dem 三维地图
tileSize 每张瓦片的大小。
scheme 坐标系统,默认值xyz。GDAL2Tiles默认使用TMS坐标系统,而大多数查看器默认使用XYZ格式。
coordinates定义数据点的坐标,x轴取值范围是[-180, 180],y轴取值范围是[-85.051129, 85.051129]。y轴取值来自于arctan(sinh(π)) * (180/π),是墨卡托投影在数学上的极限。
理论上 GeoJSON 允许 [-90, 90],但 MapLibre GL 默认使用 Web Mercator 投影(EPSG:3857),其纬度范围被限制在 ±85.0511°。超出此范围的坐标会被截断或导致渲染问题。
style.layers定义图层,可以通过addLayer方法添加。
source的值必定是style.sources中的某一个。
type的值有以下类型:
background 地图背景颜色。
fill 填充多边形区域。
line 线条。
symbol 文本标签和图标。
raster 栅格瓦片图层。
circle 圆点。
fill-extrusion 3D多边形。
heatmap 热力图。
hillshade 地形阴影。
sky 天空盒。
1
2
3
4
5
6
7
8
9
10
11
12
13
14
15
16
17
18
19
20
21
22
23
24
25
26
27
28
29
30
31
32
33
| {
id: 'background',
type: 'background',
paint: {
'background-color': '#f8f4f0',
'background-opacity': 1
}
}
{
id: 'place-labels',
type: 'symbol',
source: 'mapdata',
'source-layer': 'places',
layout: {
'text-field': ['get', 'name'],
'text-size': 12,
'icon-image': 'marker',
'text-offset': [0, 1]
}
}
{
id: 'poi-markers',
type: 'circle',
source: 'points',
paint: {
'circle-radius': 5,
'circle-color': '#3887be',
'circle-stroke-width': 1,
'circle-stroke-color': '#ffffff'
}
}
|
一般后添加的layer在上层,但某些图层有内置的优先级,比如热力图在下面,symbol在上面。
map.addLayer的第二个参数为beforeId,指要把新图层设置为id为beforeId的图层的下面。
推荐图层顺序:background、raster、hillshade、heatmap、fill、fill-extrusion、line、circle、symbol、sky。
glyphs 字体文件。
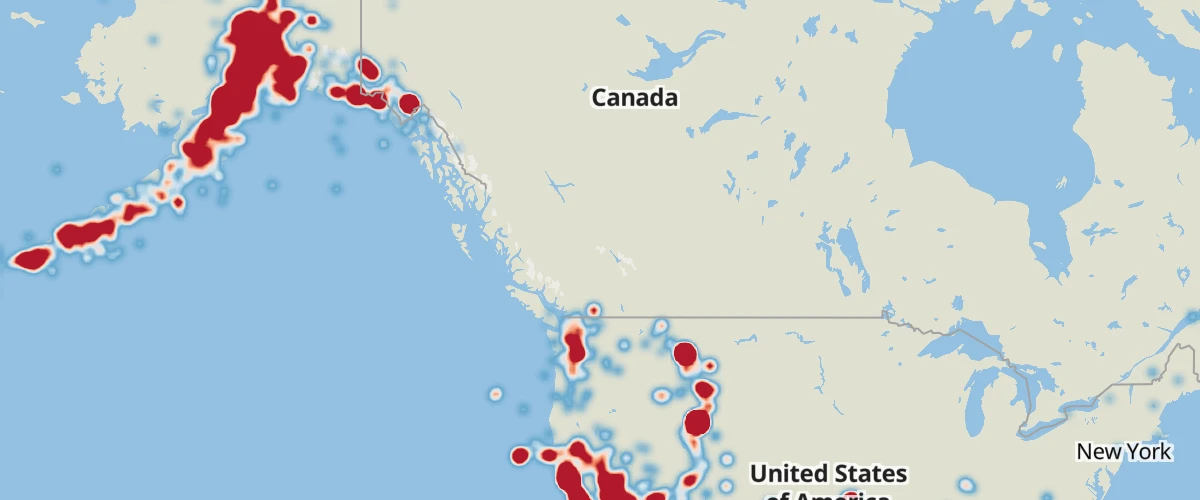
热力图
1
2
3
4
5
6
7
8
9
10
11
12
13
14
15
16
17
18
19
20
21
22
23
24
25
26
27
28
29
30
31
32
33
34
35
36
37
38
39
40
41
42
43
44
45
46
47
48
49
50
51
52
53
54
55
56
57
58
59
60
61
62
63
64
65
|
map.value.addSource('points', {
'type': 'geojson',
'data': {
type: 'FeatureCollection',
features
},
});
map.value.addLayer(
{
'id': 'heatmap',
'type': 'heatmap',
'source': 'points',
'maxzoom': 9,
'paint': {
'heatmap-weight': 1,
'heatmap-intensity': [
'interpolate',
['linear'],
['zoom'],
0,
1,
9,
3
],
'heatmap-color': [
'interpolate',
['linear'],
['heatmap-density'],
0,
'rgba(33,102,172,0)',
0.2,
'rgb(103,169,207)',
0.4,
'rgb(209,229,240)',
0.6,
'rgb(253,219,199)',
0.8,
'rgb(239,138,98)',
1,
'rgb(178,24,43)'
],
'heatmap-radius': [
'interpolate',
['linear'],
['zoom'],
0,
2,
9,
20
],
'heatmap-opacity': [
'interpolate',
['linear'],
['zoom'],
7,
1,
9,
0
]
}
},
);
|
heatmap-weight定义每个数据点的影响强度,即单个点对整体密度的贡献程度。
1
2
3
4
5
6
7
8
| 'heatmap-weight': 0.5
'heatmap-weight': ['get', 'importance']
'heatmap-weight': [
'interpolate', ['linear'], ['get', 'point_count'],
0, 0,
5, 0.5,
10, 1
]
|
heatmap-intensity控制热力图的整体强度,影响热力图的饱和度或亮度。取值通常在0-3,默认为1,高值更亮,适合数据点稀疏的情况,低值适合数据点密集的情况。
1
2
3
4
5
6
7
8
| 'heatmap-intensity': 3
'heatmap-intensity': [
'interpolate',
['linear'],
['zoom'],
0, 1,
9, 3
]
|
heatmap-radius控制每个数据点的影响半径。
heatmap-opacity控制热力图的透明度。
heatmap-color定义热力图的颜色渐变。
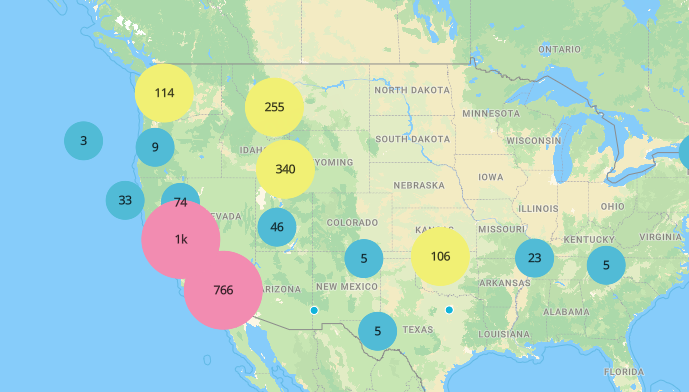
聚类
1
2
3
4
5
6
7
8
9
10
11
12
13
14
15
16
17
18
19
20
21
22
23
24
25
26
27
28
29
30
31
32
33
34
35
36
37
38
39
40
41
42
43
44
45
46
47
48
49
50
51
52
53
54
55
56
57
58
59
60
61
62
63
|
map.value.addSource('clusteredPoints', {
'type': 'geojson',
'data': {
type: 'FeatureCollection',
features
},
cluster: true,
clusterRadius: 50,
clusterMaxZoom: 14
});
map.value.addLayer({
id: 'clusters',
type: 'circle',
source: 'clusteredPoints',
filter: ['has', 'point_count'],
paint: {
'circle-color': [
'step',
['get', 'point_count'],
'#51bbd6',
100,
'#f1f075',
750,
'#f28cb1'
],
'circle-radius': [
'step',
['get', 'point_count'],
20,
100,
30,
750,
40
]
}
});
map.value.addLayer({
id: 'cluster-count',
type: 'symbol',
source: 'clusteredPoints',
filter: ['has', 'point_count'],
layout: {
'text-field': '{point_count_abbreviated}',
'text-size': 12
}
});
map.value.addLayer({
id: 'unclustered-point',
type: 'circle',
source: 'clusteredPoints',
filter: ['!', ['has', 'point_count']],
paint: {
'circle-color': '#11b4da',
'circle-radius': 4,
'circle-stroke-width': 1,
'circle-stroke-color': '#fff'
}
});
|
监听地图事件
1
2
3
| map.value.on('mouseenter', 'clusters', () => {
map.value.getCanvas().style.cursor = 'pointer';
});
|
第一个参数是事件类型,第二个参数是事件绑定的图层(可选),第三个参数是事件回调。
常用的事件类型:mouseenter、mouseleave、click等。
1
2
3
4
5
6
7
8
9
10
11
12
13
14
15
16
|
map.value.on('click', 'unclustered-point', (e) => {
const coordinates = e.features[0].geometry.coordinates.slice();
const properties = e.features[0].properties;
while (Math.abs(e.lngLat.lng - coordinates[0]) > 180) {
coordinates[0] += e.lngLat.lng > coordinates[0] ? 360 : -360;
}
new maplibregl.Popup()
.setLngLat(coordinates)
.setHTML(
`title: ${properties.title}<br>description: ${properties.description}`
)
.addTo(map.value);
});
|
数据切片
如果数据量巨大,比如五十万以上,必须要将数据在服务器进行切片生成矢量瓦片数据,不然页面卡顿、崩溃。
以node为例,我们需要先用geojson-vt将geojson格式数据转换成mvt格式数据,然后用vt-pbf压缩数据。
普通矢量瓦片
第一步,安装依赖。
第二步,数据处理
1
2
3
4
5
6
7
8
9
10
11
12
13
14
15
16
17
18
19
20
21
22
23
24
25
26
27
28
|
let tileIndex = null;
tileIndex = geojsonvt(geojsonData, {
maxZoom: options.maxZoom || 14,
tolerance: 5,
extent: 4096,
buffer: 512,
debug: 0,
lineMetrics: false,
promoteId: null,
generateId: true,
indexMaxZoom: 7,
indexMaxPoints: 500000,
solidChildren: false,
});
app.get('/tiles/:z/:x/:y.pbf', (req, res) => {
const tile = tileIndex.getTile(zoom, x, y);
const buffer = vtPbf.fromGeojsonVt({ 'geojsonLayer': tile });
res.sendFile(buffer);
});
|
第三步,使用
1
2
3
4
5
6
7
8
9
10
11
12
13
14
15
16
17
18
19
20
21
22
23
24
25
26
27
28
29
30
31
32
33
34
35
36
37
38
39
40
41
42
43
44
45
46
|
map.value.addSource('points', {
type: 'vector',
tiles: ['http://localhost:3000/tiles/{z}/{x}/{y}.pbf'],
});
map.value.addLayer(
{
'id': 'heatmap',
'type': 'heatmap',
'source': 'points',
'source-layer': 'geojsonLayer',
'maxzoom': 14,
'paint': {
'heatmap-weight': 1,
'heatmap-intensity': [
'interpolate',
['linear'],
['zoom'],
0,
1,
9,
2
],
'heatmap-color': [
'interpolate',
['linear'],
['heatmap-density'],
0,
'rgba(33,102,172,0)',
0.2,
'rgb(103,169,207)',
0.4,
'rgb(209,229,240)',
0.6,
'rgb(253,219,199)',
0.8,
'rgb(239,138,98)',
1,
'rgb(178,24,43)'
],
'heatmap-radius': 30,
}
},
);
|
聚类矢量瓦片
如果数据量巨大又要显示聚类,则需要在服务端聚类。
第一步,安装依赖。
第二步,聚类
1
2
3
4
5
6
7
8
9
10
11
12
13
14
15
16
17
18
19
20
21
22
23
24
25
26
27
28
29
30
31
32
33
34
35
36
37
38
39
40
41
42
43
44
| // 创建索引
let clusterIndex = null;
// 生成随机点数据
function generateRandomPoints(count = 10000 * 100) {
const features = [];
for (let i = 0; i < count; i++) {
const lng = Math.random() * 360 - 180; // 经度范围:-180到180
const lat = Math.random() * 170 - 85; // 纬度范围:-85到85
features.push({
type: 'Feature',
properties: {
id: i,
name: `点位 ${i}`,
pos: `${lng},${lat}`
},
geometry: {
type: 'Point',
coordinates: [lng, lat]
}
});
}
// !!! here
clusterIndex = new Supercluster({
radius: 50, // 聚合像素半径
maxZoom: 18, // 最大聚合层级
minZoom: 0, // 最小聚合层级
map: props => ({
count: props.count || 1 // 保留原始计数
})
})
clusterIndex.load(features);
const geojson = {
type: 'FeatureCollection',
features
};
return geojson;
}
|
第三步,处理数据
1
2
3
4
5
6
7
8
9
10
11
12
| app.get('/tiles/:z/:x/:y.pbf', (req, res) => {
const clusters = clusterIndex.getClusters([-180, -90, 180, 90], z)
const tile = geojsonvt({
type: 'FeatureCollection',
features: clusters
}).getTile(z, x, y)
const buffer = vtPbf.fromGeojsonVt({ 'geojsonLayer': tile });
res.sendFile(buffer);
});
|
使用方法与普通切片相同。
性能优化
方法1:geojson格式数据可以压缩json。
方法2:根据缩放显示不同layer,低缩放等级只显示热力图,高缩放等级只显示聚类圆圈。
方法3:启用webgl2,需要判断浏览器是否支持。
参考
mapbox-gl 中文文档
maplibre-gl 官方文档
geojson-vt插件
vt-pbf插件


.png)